Physical Address
304 North Cardinal St.
Dorchester Center, MA 02124
Physical Address
304 North Cardinal St.
Dorchester Center, MA 02124

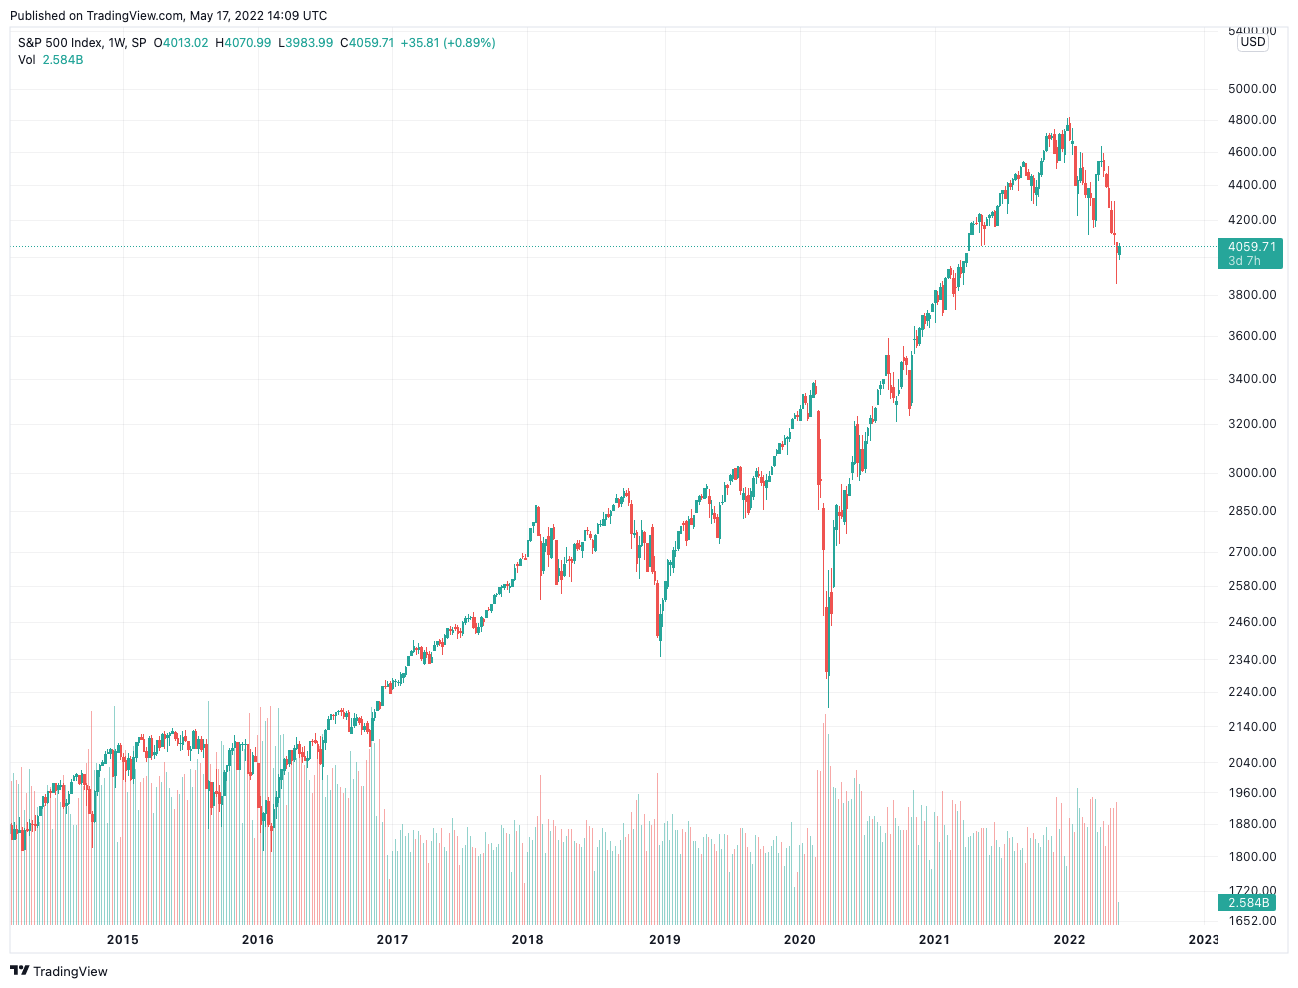
Here’s a test worth doing once. Open any free chart of the Dow, set it to “max,” and look for 1929. You’ll find it if you squint, a little ripple sitting on what looks like a flat floor. Then remember that ripple was the market losing about eighty-nine percent of its value.
So who flattened it?
Nobody, really. The default setting did. Nearly all the stock market graphs people pull up on their phones run on a linear scale, and almost nobody touches the toggle. I’d go as far as calling it the most ignored setting in retail investing, which is a little funny given how much it changes what you think you’re looking at.
That’s the actual choice hiding behind the jargon.
A linear axis gives every dollar the same height. Ten to twenty bucks takes up exactly as much room as a hundred to a hundred and ten. A log axis doesn’t care about dollars at all; it cares about percentage moves, so doubling from ten to twenty looks just as tall as doubling from a hundred to two hundred, and that hundred-to-hundred-ten move shrinks to a sliver (it’s only ten percent, after all).
Same data. Different question being answered.
Most decent stock market graphs let you flip between the two without digging through menus, and honestly that’s the first thing I’d look for in any charting tool, before indicators, before overlays, before any of it. If you can’t tell which scale you’re on, you’re reading somebody else’s assumptions as though they were facts about the business.
Back to the Dow, with actual numbers this time.
From its September 1929 peak (somewhere near three hundred eighty-one) to the July 1932 low (near forty-one), the index dropped about three hundred forty points. Brutal, but in points, tiny.
Now 2020. The COVID selloff took the Dow from roughly twenty-nine thousand five hundred down to about eighteen thousand six hundred in around six weeks. Call it eleven thousand points. Scary? Sure. People remember that March for good reason.
Put both on linear stock market graphs and 2020 looks like the apocalypse while 1929 is a speed bump. The truth runs the other way. The 2020 drop was around thirty-seven percent and got erased before the year was out. The 1929 crash ate close to ninety percent, and the Dow didn’t see its old high again until late 1954.
That’s not a small distortion. It’s an upside-down one, and it happens because dollar amounts get bigger as markets grow, so recent moves will always look scarier on a linear axis than older ones. Always. It’s baked into the math.
I don’t hate it. For short-term stock market graphs it’s arguably the better pick.
If a stock has bounced between forty-five and fifty-five dollars for six months, the two scales look almost the same anyway, and linear wins on readability because the gridlines line up with the prices on your brokerage statement. Same goes when you’re placing a stop-loss or checking how far underwater a position is. Those are dollar questions. Use a dollar axis. Plenty of short-term traders live there happily and never need to leave.
Where people get burned is stretching that habit across ten or twenty years without thinking about it.
A company growing earnings at, say, ten percent a year will trace a fairly straight line on a log chart. Boring, steady, kind of beautiful if you like that sort of thing.
Plot it on linear stock market graphs, though, and it turns into a hockey stick: years of nothing, then a sudden rocket. Which tempts you to believe something changed (new management, a breakthrough product, whatever) when the company was just doing what it had always done.
Losses get the same treatment in reverse. A fifty percent drop needs a hundred percent gain to climb back, and only the log view shows how deep that hole really is next to the recovery.
This matters most when you lay price over earnings. If the earnings line runs straight on a log chart and price drifts above or below it, you can tell pretty quickly whether the market is charging a premium or offering a discount for the same growth. On linear, once the numbers get big, that relationship turns to mush.
Look at the axis labels on stock market graphs before you look at the line. Evenly spaced dollar amounts (ten, twenty, thirty) mean linear. Labels that jump by multiples, like ten, twenty, fifty, one hundred, mean log.
My own rough rule, for what it’s worth: more than five years of data, or a price that’s more than doubled, and I check the log view first. It isn’t scientific. It doesn’t need to be, since the whole point is to stop the default from making the call for you.
Also, when someone posts a chart to win an argument, whether it’s a fund manager, a newsletter writer or some guy on social media, mentally flip the scale. Sometimes nothing changes. Other times the whole argument falls apart, which tells you something about the person posting it.
The y-axis feels like a technical detail. It isn’t. On stock market graphs it can shrink a historic collapse into a footnote, or turn a slow, steady grower into an overnight story that never really happened.
Neither scale is lying, exactly. They’re answering different questions, and most people don’t realize which question they’ve been handed.
Worth thirty seconds of checking, every time you open a chart.